
Trading Tutorials
How to Draw Support and Resistance (and Why Levels Break)
A support or resistance level is not a magic price — it is a zone where enough buyers or sellers acted before that people expect them to act again. Here is how to draw one, how to tell a strong zone from a weak one, and what a break actually means.
Disclosure: This guide is educational and is not financial advice. Nothing here predicts price. Crypto is volatile and you can lose money.
Every beginner eventually draws lines on a chart. Most draw them badly — too many, too precise, and in places where nothing actually happened. Support and resistance are useful, but only once you understand what a level actually is: not a magic number, but a price area where enough buyers or sellers acted before that a meaningful number of people expect them to act again.
That distinction changes everything about how you draw and use them.
What a level actually represents
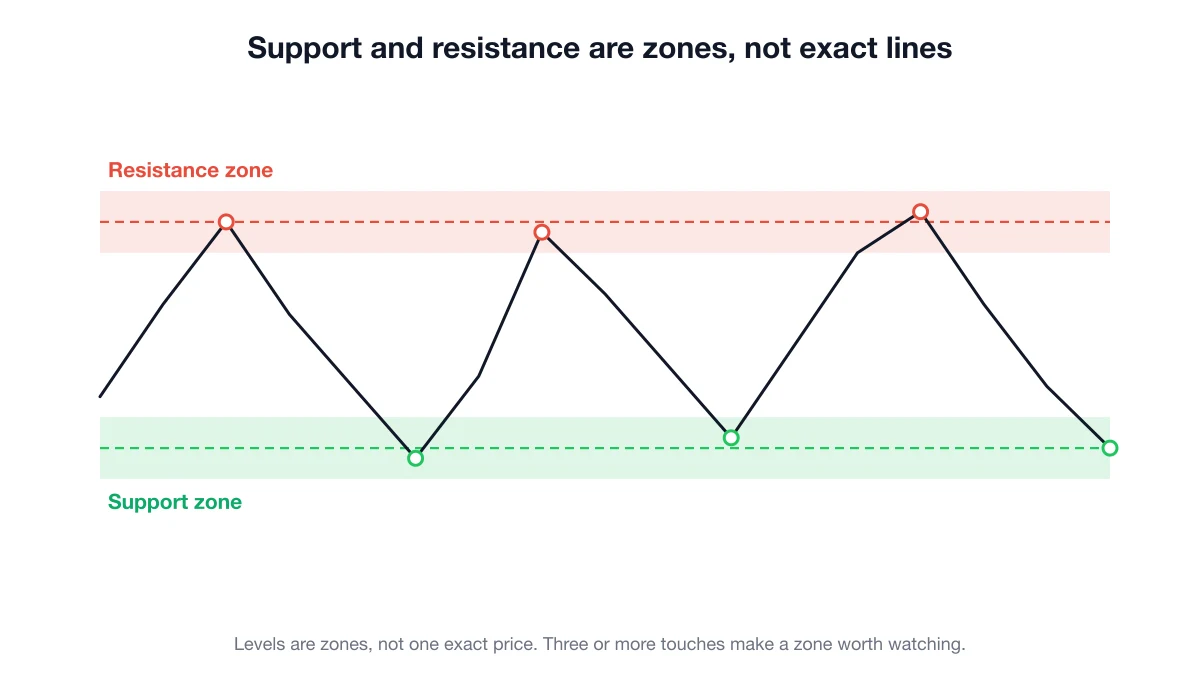
A chart is a record of decisions. When price fell to an area three separate times and buyers stepped in each time, that area is now stored in a lot of people's heads. Some are waiting to buy there again. Some who sold too early want a second chance. Some who bought there have orders to add. None of this is mystical — it is just concentrated memory, and it makes that area more likely than a random price to produce a reaction.
The same works above: an area where sellers repeatedly appeared becomes resistance. If you can read a candlestick chart, you already have the raw material — a level is simply where several candles refused to go further.
The important consequence: a level with no history is not a level. A line you drew because it looked tidy has no crowd behind it.
How to draw a level: five steps
- Zoom out first. Start on the daily chart. Levels that matter are visible without squinting. If you have to zoom in to find it, it is noise.
- Look for reactions, not exact prices. You want places where price arrived and then clearly turned — a sharp reversal, a long wick, a multi-candle pause.
- Require at least two touches, prefer three. One touch is a coincidence. Three touches is a pattern other people can also see.
- Draw a zone, not a hairline. Connect the wicks and bodies loosely. If the reactions happened between $2,180 and $2,210, your level is that whole band.
- Delete the rest. If your chart has more than four or five levels, you will find a "level" near any price, which is the same as having none.
Why zones beat exact lines
Beginners often say a level "did not work" because price went through it by a small amount and then reversed. That is a drawing problem, not a market problem. Different exchanges show slightly different prices, wicks overshoot, and large orders sit in ranges rather than at single prices.
Treat a level as a band roughly the width of the recent candle bodies in that area. A move a little way into your zone is normal behaviour. A decisive close well beyond it is a different event — and that is what a break means.
When a level breaks, it often changes role
The most useful single behaviour in this whole topic: broken resistance frequently becomes support, and broken support frequently becomes resistance.
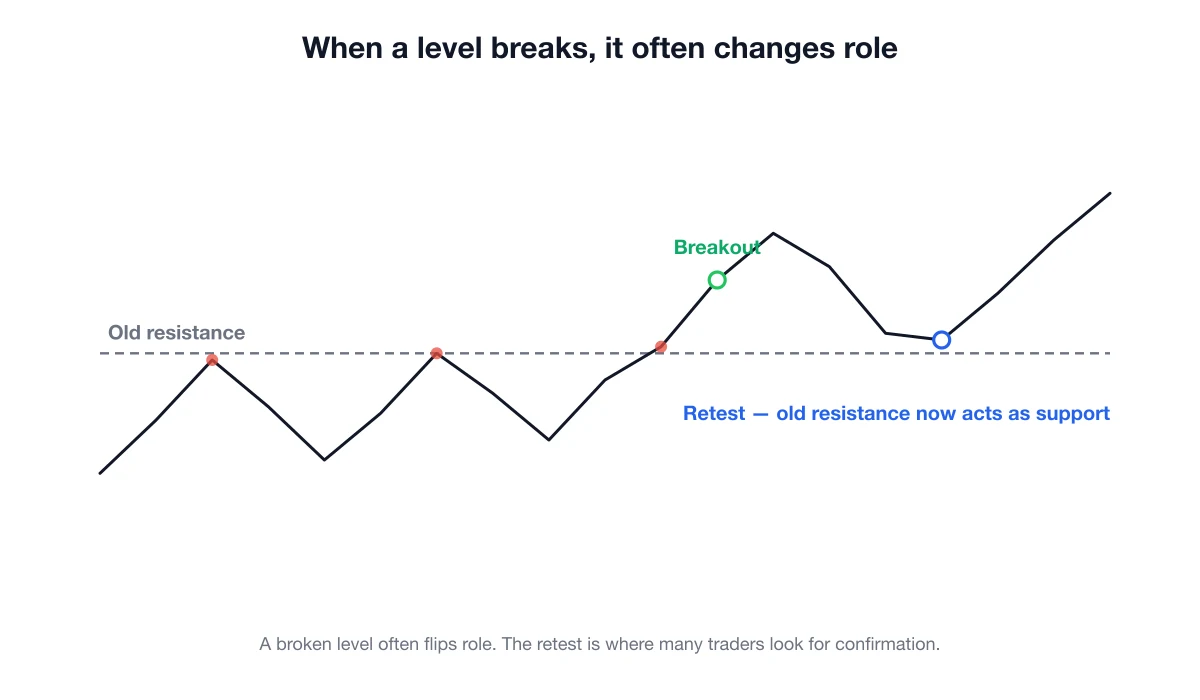
The logic is human. Sellers who defended that area have been proven wrong and many have closed out. Buyers who missed the breakout now see the old ceiling as a reasonable entry. So when price returns to the level — the retest — you often get a second reaction, this time in the opposite direction.
A retest is not a guarantee. It is a place where the market has to show its hand, and where the level either confirms its new role or fails immediately. Both outcomes give you information quickly, which is exactly what a useful reference point should do.
Three mistakes that cost beginners money
Drawing levels to justify a trade you already want. If you want to buy, you will find support. Draw your levels before you have an opinion, ideally on a chart with no position on it.
Treating a level as a prediction. A level tells you where a reaction is more likely, not that one will happen or how far it will go. Combine it with what the candles do at the level, not with hope.
Ignoring the cost of being wrong. A level gives you something most beginners lack: a clear point at which your idea is invalid. If your reason for buying was "support held," then a decisive close below that support means the reason is gone. That is not a defeat — that is the level doing its job. Position sizing matters far more than line placement; if a single trade can hurt you, no amount of chart drawing will save you. This applies double to anything involving leverage.
How to actually use this
Use levels as reference points, not signals. Before you act, ask three questions: Is this zone built on real reactions? What would price have to do here to prove me wrong? Is my position small enough that being wrong is boring?
If you cannot answer the second question, you do not have a trade — you have a hope. And be careful where you get your levels: anyone promising exact prices and guaranteed reversals is selling something. That is one of the oldest patterns in crypto scams.
Trading costs also matter more than most beginners assume. Frequent trading around minor levels quietly transfers your capital into fees even when your direction is right.
FAQ
How many touches make a level valid? Two is the minimum, three or more is meaningfully better. What matters is that other participants can see it too.
Should I use round numbers? They often coincide with real levels because people place orders there. Use them only when the chart also shows reactions at that price.
Do levels work on small timeframes? They exist, but they are weaker and get broken constantly. Beginners are better served by daily and 4-hour levels.
What is the difference between a level and a trend line? A level is horizontal and reflects a fixed price. A trend line is diagonal and reflects a changing price. Horizontal levels are more objective and a better place to start.
Does this work for altcoins? The logic works anywhere there are enough participants. On thin, low-liquidity altcoins, a single large order can break any level, so treat them with more caution.
Educational content only. Not financial advice. Levels describe where reactions have happened, not where price must go. Last reviewed: September 2026.