
Trading Tutorials
Moving Averages Explained: SMA vs EMA and What Crossovers Mean
A moving average is just the average price of the last N candles, redrawn each period. That simplicity is its strength and its limit: it smooths noise, but it can only describe what already happened. Here is what SMA and EMA actually do, and why a golden cross is a summary rather than a signal.
Disclosure: Educational content only, not financial advice. Indicators describe past prices; they do not predict future ones. Crypto is volatile and you can lose money.
A moving average is the least mysterious indicator on any chart. Take the closing prices of the last N candles, average them, plot the result, and repeat next candle. That is the whole thing.
Its value is that it removes noise so you can see direction. Its limit follows from the same fact: an average of past prices can only ever describe the past. Almost every mistake beginners make with moving averages comes from forgetting that second sentence.
SMA and EMA: the same idea, weighted differently
A simple moving average (SMA) treats every candle in its window equally. The candle from twenty periods ago counts exactly as much as yesterday's.
An exponential moving average (EMA) gives more weight to recent candles. Older data still matters, but it fades. The practical result is that the EMA turns sooner when price changes direction, while the SMA stays smoother and reacts later.
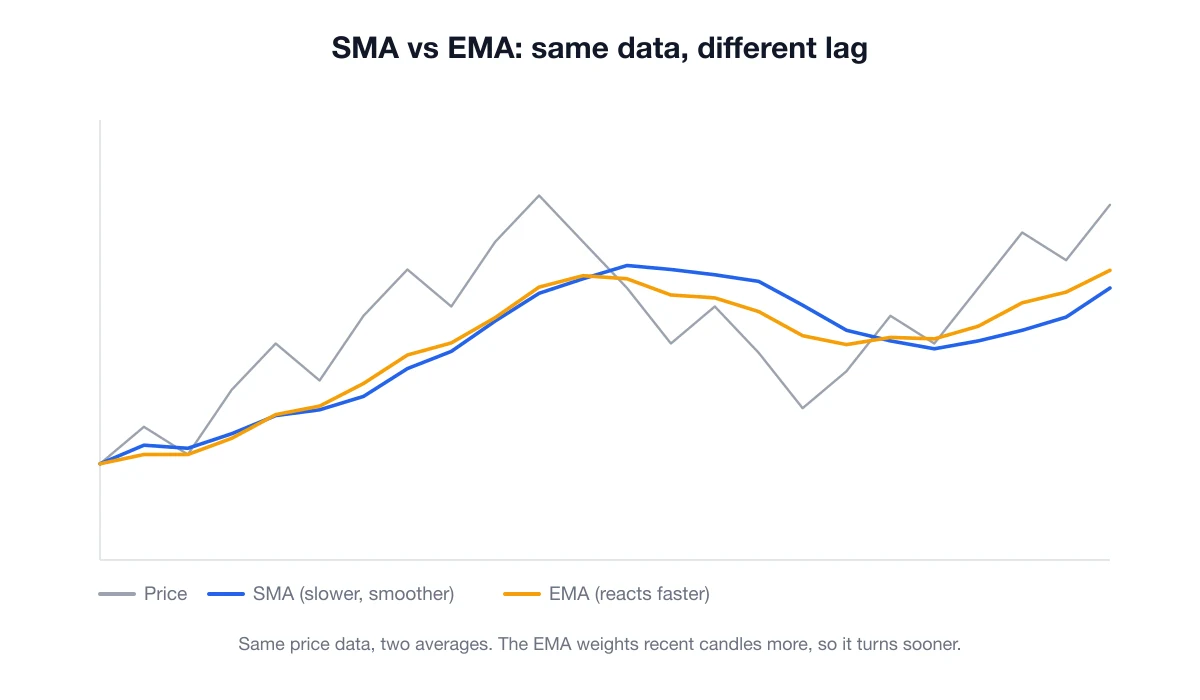
Neither is better. They answer slightly different questions. The SMA asks "what has the average price been over this window?" The EMA asks "what has the average price been, with more attention on what just happened?"
The period matters more than the type. A 20-period average describes a few weeks of daily candles; a 200-period average describes most of a year. Short averages are responsive and noisy. Long averages are stable and slow. Choosing a period is choosing a timescale, and there is no correct answer — only an answer that matches the timeframe you actually trade.
What moving averages are genuinely useful for
Seeing direction without staring. If price has been above a rising 50-period average for months, you do not need to interpret anything. The trend is up. That sounds trivial, but beginners routinely fight obvious trends because a single candle scared them.
Providing dynamic reference areas. In a strong trend, price often pulls back toward a medium-length average and resumes. This is closely related to support and resistance — the difference is that a moving average moves, so it is a softer reference than a horizontal zone.
Filtering your own impulses. A simple rule such as "I only look for long setups while price is above the 200-period average" removes a large category of bad trades. Not because the average is magic, but because it stops you buying into sustained downtrends.
The crossover problem
Two averages of different lengths will eventually cross. When a shorter average crosses above a longer one, people call it a golden cross; the opposite is a death cross. These names get far more attention than they deserve.
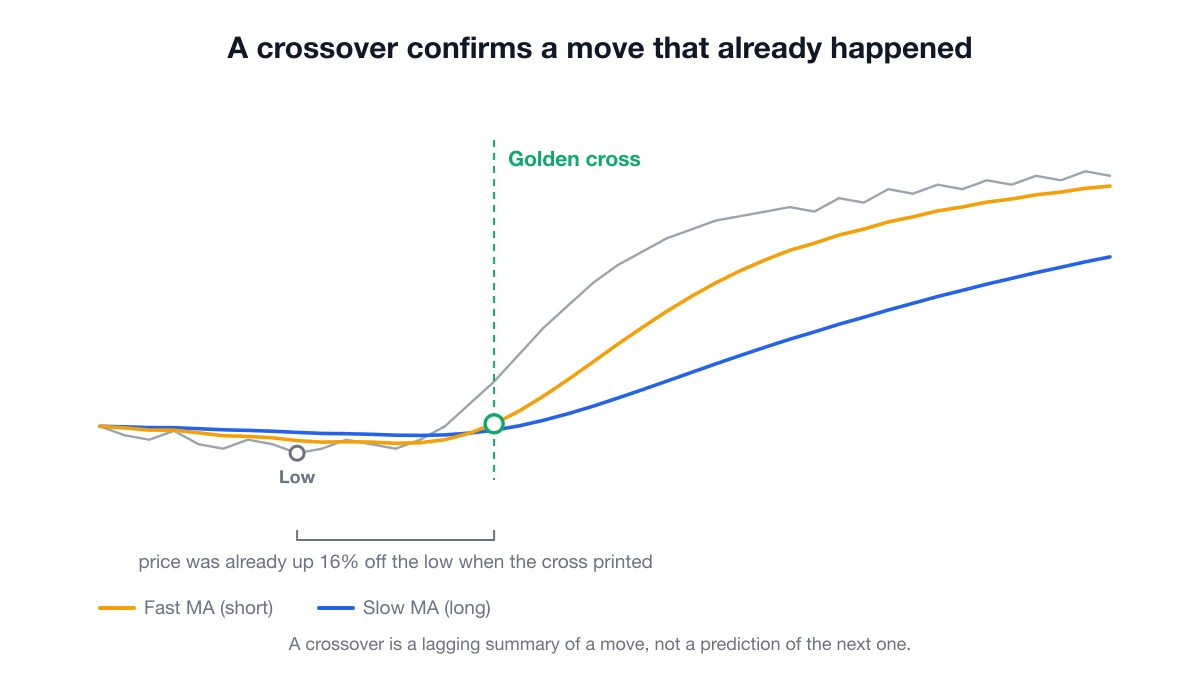
Look at what has to happen for a crossover to occur. The short average can only rise above the long one after price has already moved up enough, for long enough, to drag it there. The cross is arithmetic confirmation of a move that has already happened. In the chart above, price was already well off its low by the time the cross appeared.
That does not make crossovers useless. A trend that has persisted long enough to produce a crossover is, empirically, more likely to continue than a one-day spike. But it means a crossover is a description of conditions, not an entry signal, and certainly not a reason to buy at any price.
The situation where crossovers perform worst is sideways markets, where price oscillates and the two averages cross back and forth repeatedly. Each crossover looks like a signal; most are noise. Trading every one of them is an efficient way to convert your capital into trading fees.
Three ways beginners misuse moving averages
Adding more averages. Four averages do not give you four times the information. They give you a chart where something is always crossing something, so you can always justify acting.
Treating the average as a hard line. Price touching an average means very little on its own. What the candles do there matters far more — which is why it helps to be able to read candlesticks before adding indicators on top of them.
Optimising the period on past data. If you test twenty settings and pick the one that would have worked best last year, you have not found an edge; you have described history. The setting that fit best is often the one most fitted to noise.
A sane way to use them
Pick one or two periods and keep them. Use the longer average to answer "which direction am I allowed to trade?" and the shorter one to see when momentum is fading. Never treat a cross as an instruction. Ask instead: is this consistent with what price and structure are already telling me?
And keep the risk side in proportion. An indicator cannot size your position or define where you are wrong. If you are considering anything with leverage, that gap matters far more than which average you chose.
Finally, be sceptical of anyone selling a "secret" moving average setup. Every setting is public, free, and has been tested by millions of people. Promises of a proprietary configuration with guaranteed results are a familiar shape of crypto scam.
FAQ
Which is better, SMA or EMA? Neither. EMA reacts sooner and gives more false turns; SMA is steadier and later. Pick one, learn how it behaves, and stop switching.
What period should a beginner use? Common choices are 20, 50 and 200 on the daily chart. Their popularity is itself mildly useful, because many people watch the same lines.
Do moving averages work on low-liquidity coins? They compute fine, but thin altcoins produce erratic averages because a single large order can move price sharply.
Can I trade using only moving averages? You can, but you would be trading a lagging summary with no notion of risk or context. Averages describe; they do not decide.
Why did the average not act as support? Because it is not a rule. It is a line drawn from arithmetic. Sometimes price respects it, sometimes it does not, and no setting changes that.
Educational content only. Not financial advice. Indicators summarise past price; they cannot forecast it. Last reviewed: September 2026.