
Trading Tutorials
RSI Explained: Why "Overbought" Does Not Mean "Sell"
RSI measures how one-sided recent price moves have been, on a 0-100 scale. It does not measure value, and it does not know what price will do next. The single most expensive beginner mistake is reading 'overbought' as 'sell'.
Disclosure: Educational content only, not financial advice. RSI describes past momentum and cannot predict price. Crypto is volatile and you can lose money.
The Relative Strength Index takes a simple question — over the last N candles, how much of the movement was up versus down? — and expresses the answer as a number between 0 and 100. High means recent moves have been mostly upward. Low means mostly downward.
That is genuinely all it measures. RSI does not know what an asset is worth, whether it is expensive, or what happens tomorrow. It is a description of recent one-sidedness, nothing more.
Almost all of the trouble comes from two words that were attached to it decades ago: overbought and oversold.
What 70 and 30 actually mean
By convention, RSI above 70 is called overbought and below 30 oversold. Those words sound like verdicts. They are not. They are thresholds on a momentum scale, and crossing one tells you only that recent moves have been strongly one-directional.
Here is the part that costs beginners the most money: in a genuine trend, that condition is normal and can persist for a very long time.
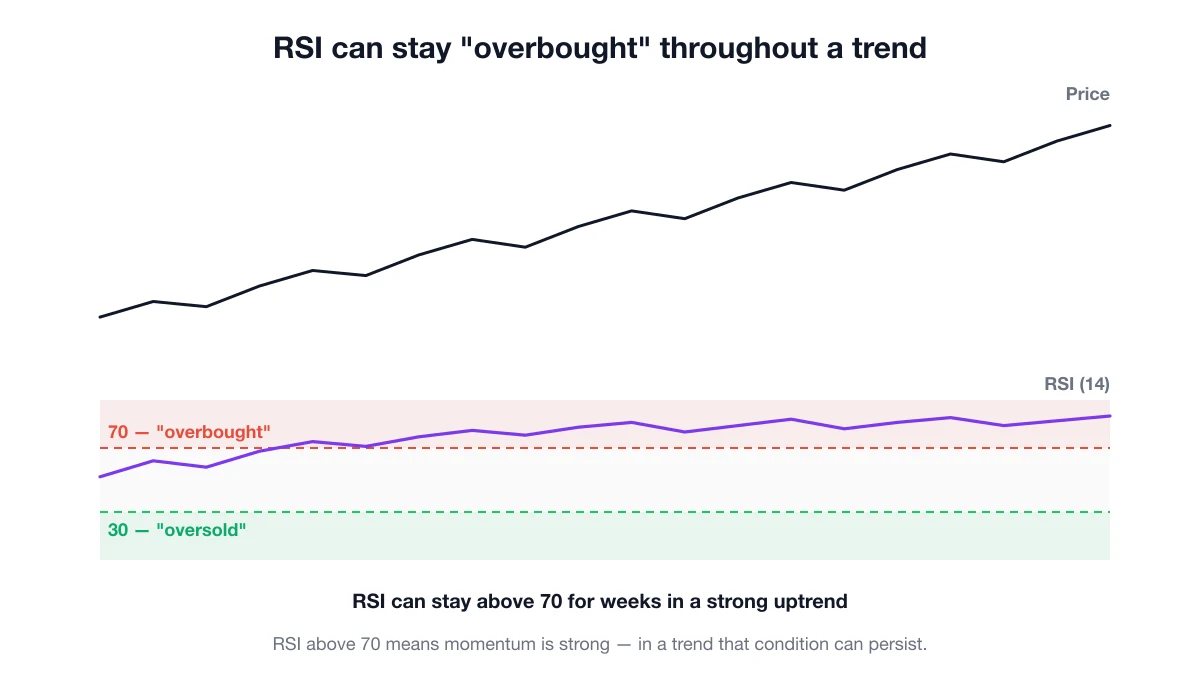
In the chart above, RSI goes above 70 early and simply stays there while price keeps climbing. Anyone who sold at the first "overbought" reading sold at the beginning of the move and then watched it continue without them. Selling strength because a number crossed 70 is not risk management; it is confusing a momentum reading with a valuation.
The mirror image is equally expensive. In a sustained downtrend, RSI can sit under 30 for weeks. "It is oversold, it must bounce" is how people catch falling knives.
Where RSI is actually useful
As a description of character, not a trigger. An asset whose RSI keeps reaching 80 in rallies and only falls to 45 in pullbacks is behaving very differently from one that tops at 60 and bottoms at 25. That pattern tells you something about the current regime.
In combination with structure. An RSI reading means much more when it happens at a level you already care about. RSI hitting 30 in the middle of nowhere is noise; RSI hitting 30 exactly where a well-drawn support zone sits is at least a coincidence worth examining.
As a way to notice fading momentum. This is what divergence is for — and it deserves care, because it is the most over-sold idea in retail trading.
Divergence, described honestly
Divergence means price and RSI disagree. In bearish divergence, price makes a higher high while RSI makes a lower high: the new price high was achieved with less momentum behind it.
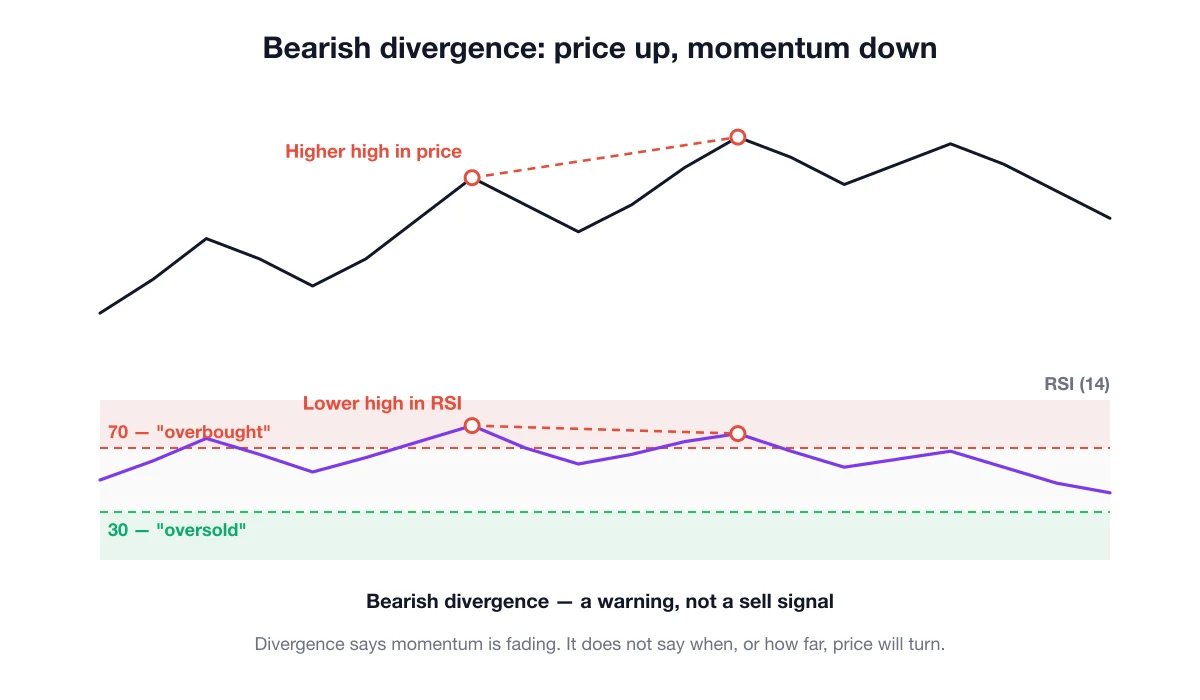
That is a real, meaningful observation. Fewer participants pushed harder for a smaller result. It is worth noticing.
What divergence does not tell you: when the turn will happen, whether it will happen at all, or how far it would go. Divergence can persist for a long time, and price can make three more higher highs while RSI keeps making lower ones. Traders who treat divergence as a sell signal spend a lot of money learning this.
The honest framing: divergence is a reason to pay closer attention and tighten your assumptions, not a reason to act on its own. It works best as a supporting observation when structure and price action already suggest the same thing.
Four mistakes worth avoiding
Reading 70 as "sell" and 30 as "buy". This is the main one. In a trend, these levels mark strength, not exhaustion.
Changing the period until it agrees with you. RSI(14) is the default. If you cycle through 7, 9, 21 and 25 until one produces the signal you wanted, you are not analysing anything.
Stacking indicators that measure the same thing. RSI, Stochastic and MACD are all momentum-derived. Running all three does not give you three independent opinions; it gives you one opinion repeated, which feels like confirmation and is not.
Trading every oscillation. Momentum indicators generate a lot of readings. Acting on all of them converts capital into fees with impressive efficiency, and it is especially dangerous with leverage.
Putting it in its place
RSI is a supporting instrument. It answers "how one-sided has recent movement been?" and nothing else. Combine it with a chart you can actually read — knowing how to read candlesticks and where your moving averages sit will do more for you than any oscillator setting.
Before acting on an RSI reading, ask what would have to happen for you to be wrong, and whether your position is small enough that being wrong is uneventful. If an indicator is the only reason for a trade, that is usually a sign the trade does not exist.
Be sceptical of anyone selling RSI-based "signals" or bots promising a fixed win rate. The indicator is public, its formula is fifty years old, and no setting of it produces guaranteed outcomes. Guarantees are a standard feature of crypto scams.
FAQ
What period should I use? 14 is the default and the one most people watch. Shorter periods produce more signals and more noise.
Can RSI go to 100 or 0? In principle yes, in practice it approaches extremes only during violent one-directional moves.
Does RSI work on all timeframes? It calculates on any timeframe, but low timeframes generate constant readings that are mostly noise. Daily and 4-hour are more useful for beginners.
Is bullish divergence more reliable than bearish? Neither is reliable in the sense of predicting. Both describe fading momentum in one direction.
Does RSI work on small altcoins? It computes, but on thin altcoins a single large order can send RSI to an extreme without meaning much at all.
Educational content only. Not financial advice. RSI measures recent momentum, not value or future direction. Last reviewed: September 2026.