
Trading Tutorials
How to Read Trading Volume: Confirmation, Divergence and Fake Breakouts
Price tells you what happened. Volume tells you how many people were involved. That second number is what separates a breakout worth respecting from one that quietly fails three candles later.
Disclosure: Educational content only, not financial advice. Volume describes participation in past candles; it does not predict price. Crypto is volatile and you can lose money.
Most beginners read charts with the volume panel switched off, or switched on and ignored. That is a shame, because volume answers a question price alone cannot: how many people were actually involved in this move?
A 5% rally on the heaviest volume in a month and a 5% rally on the lightest volume in a month look identical on a price chart. They are not the same event.
What volume actually measures
Volume is the quantity of the asset traded during a candle. Every trade has a buyer and a seller, so volume does not tell you which side "won" — a common misconception. It tells you how much activity it took to produce that candle.
Think of it as the weight behind a move. Price shows direction; volume shows conviction. A large move on tiny volume means very few participants were needed to push price that far, which usually means very few will be needed to push it back.
The main use: confirming a breakout
The single most practical application is judging whether a break of a level is real.
When price breaks out of a support or resistance zone, you want to see participation arrive with it. A breakout accompanied by clearly elevated volume means new money engaged at that price. A breakout on volume no higher than the preceding quiet range means almost nobody showed up.
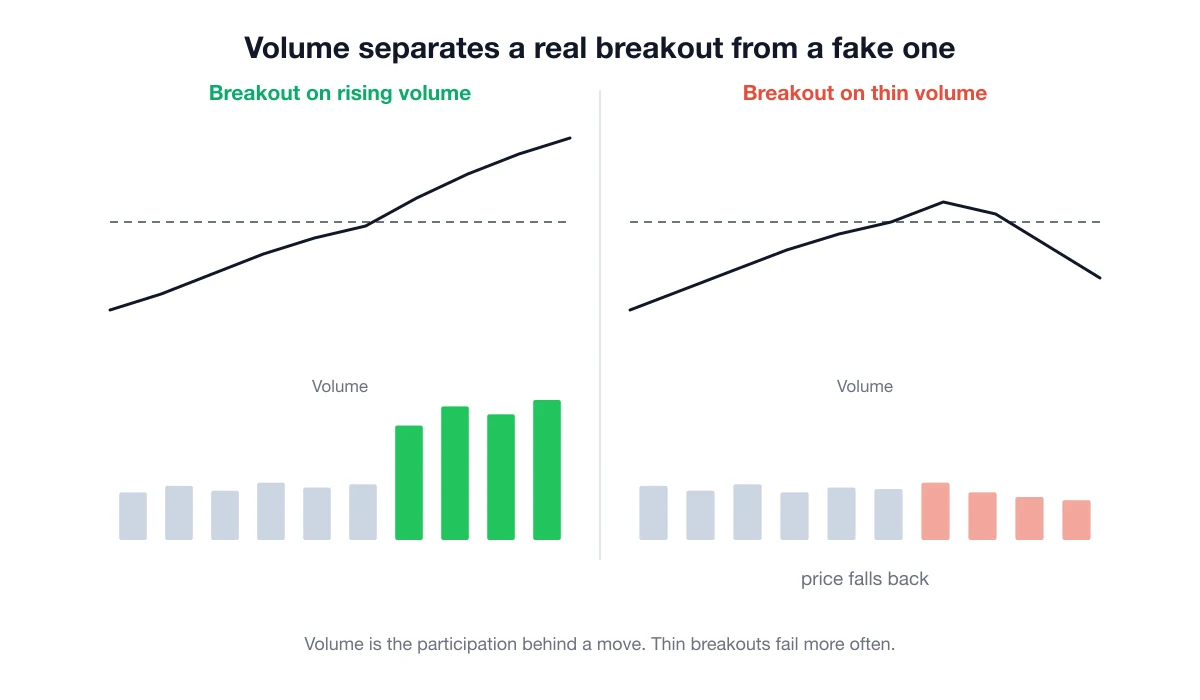
The right-hand case is the classic fake breakout. Price pokes above the level, the volume bars stay small, and within a few candles price is back inside the range — often trapping everyone who bought the break. This is not a rule and it is not a guarantee, but it is one of the few genuinely useful filters available to a beginner.
Note the emphasis on relative volume. There is no absolute number that means "high." Volume is only meaningful compared with the recent volume of the same asset. A quiet coin's busiest day may be less than a major asset's quietest hour.
Volume divergence: the move is losing its audience
If price keeps making new highs while volume on each successive push gets smaller, the advance is being carried by fewer and fewer participants. That is worth noticing, in the same way that momentum divergence on RSI is worth noticing — and with exactly the same caveat: it describes a condition, not a timing.
Trends can thin out and then resume. Declining volume is a reason to reduce your confidence, not a reason to reverse your view.
The volume climax
The opposite pattern is a sudden, enormous volume bar — far larger than anything nearby — often at the end of an extended move.
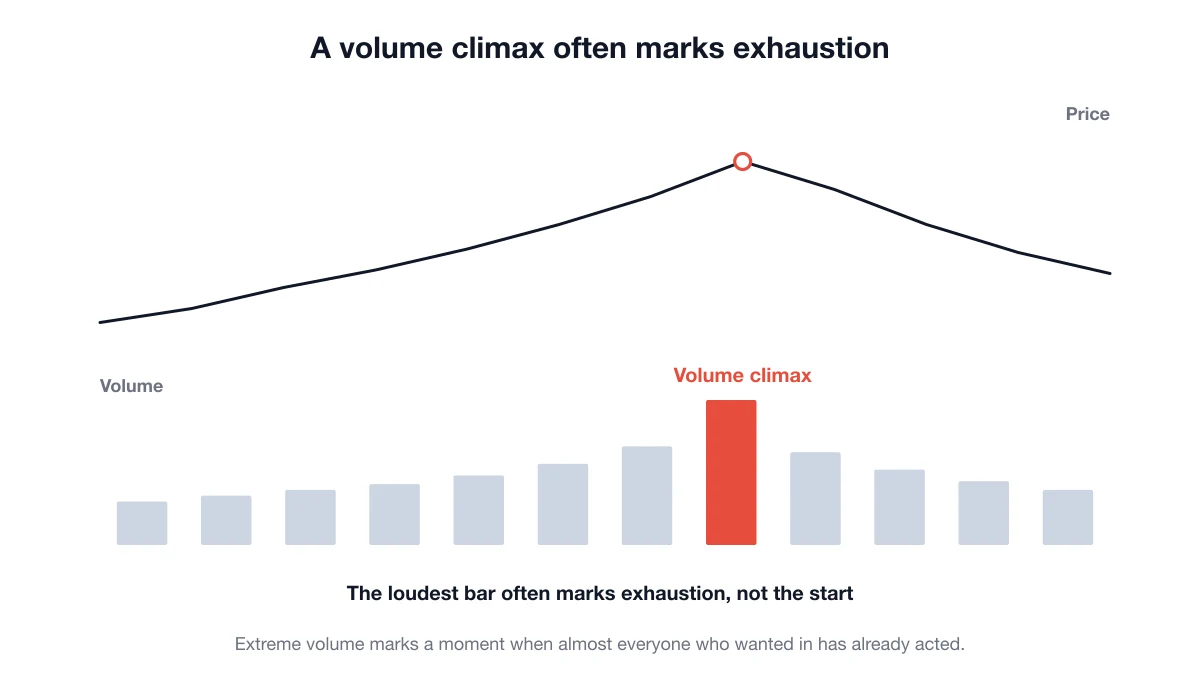
The interpretation is uncomfortable but logical. Extreme volume at the end of a long advance means an unusually large number of people transacted at that price. Many of them are late buyers acting on emotion, and the sellers meeting them are often the people who bought much lower. Once nearly everyone who wanted in has acted, there is little fuel left.
A climax bar does not mean "sell now." Sometimes it marks a pause; sometimes the move continues after a rest. What it does reliably indicate is that a lot of positioning changed hands at that price, which makes that area worth remembering as a future level.
Where volume data misleads
Different exchanges, different volume. Crypto has no single consolidated tape. The volume you see is the volume on whichever venue your chart is drawing from. Comparing a chart from one exchange with a claim about "total market volume" is comparing different things.
Reported volume is not always real. Volume figures for small tokens have historically been inflated by wash trading. Treat the volume numbers on obscure altcoins with far more scepticism than those on major pairs.
Derivatives volume is not spot volume. Futures and perpetuals have their own volume, which behaves differently and can be dominated by leveraged positioning rather than investment.
Time-of-day and weekend effects. Crypto trades continuously, but participation is not constant. Low weekend volume is normal and does not by itself imply weakness.
Using volume without overusing it
Add the volume panel to your chart and look at it in one specific situation: when price does something significant at a level you already care about. That is where it adds the most information and the least noise.
Do not build a system out of volume alone. It is context, not a signal. It works best layered onto skills you already have — being able to read candlesticks, knowing where your moving averages sit, and having levels drawn before you have an opinion.
And be direct with yourself about cost. Every trade you take because a volume bar looked exciting has a real price attached in fees and spread. Anyone selling "volume-based signals" with promised win rates is selling certainty that does not exist, which is the standard shape of a crypto scam.
FAQ
Does high volume mean buyers are winning? No. Every trade has both sides. High volume means high activity, not directional victory.
What counts as high volume? Only relative to the recent volume of the same asset on the same chart. There is no universal threshold.
Should I trust volume on a small altcoin? Be cautious. Thin markets and historical wash trading make those figures far less reliable.
Is low volume always bad? No. Quiet consolidation on low volume is normal and often healthy. Low volume matters most when it accompanies a supposedly important move.
Does volume work on the daily chart or intraday? Both, but daily volume is cleaner. Intraday volume is heavily affected by time-of-day patterns.
Educational content only. Not financial advice. Volume describes participation in candles that have already closed. Last reviewed: October 2026.